
SigNoz LiteLLM Integration
import Tabs from '@theme/Tabs'; import TabItem from '@theme/TabItem';
Overview
SigNoz LiteLLM Integration
For more details on setting up observability for LiteLLM, check out the SigNoz LiteLLM observability docs.
Overview
This guide walks you through setting up observability and monitoring for LiteLLM SDK and Proxy Server using OpenTelemetry and exporting logs, traces, and metrics to SigNoz. With this integration, you can observe various models performance, capture request/response details, and track system-level metrics in SigNoz, giving you real-time visibility into latency, error rates, and usage trends for your LiteLLM applications.
Instrumenting LiteLLM in your AI applications with telemetry ensures full observability across your AI workflows, making it easier to debug issues, optimize performance, and understand user interactions. By leveraging SigNoz, you can analyze correlated traces, logs, and metrics in unified dashboards, configure alerts, and gain actionable insights to continuously improve reliability, responsiveness, and user experience.
Prerequisites
- A SigNoz Cloud account with an active ingestion key
- Internet access to send telemetry data to SigNoz Cloud
- LiteLLM SDK or Proxy integration
- For Python:
uvinstalled for managing Python packages and (optional but recommended) a Python virtual environment to isolate dependencies
Monitoring LiteLLM
LiteLLM can be monitored in two ways: using the LiteLLM SDK (directly embedded in your Python application code for programmatic LLM calls) or the LiteLLM Proxy Server (a standalone server that acts as a centralized gateway for managing and routing LLM requests across your infrastructure).
For more detailed info on instrumenting your LiteLLM SDK applications click here.
No-code auto-instrumentation is recommended for quick setup with minimal code changes. It's ideal when you want to get observability up and running without modifying your application code and are leveraging standard instrumentor libraries.
Step 1: Install the necessary packages in your Python environment.
uv add \\
  opentelemetry-api \\
  opentelemetry-distro \\
  opentelemetry-exporter-otlp \\
  httpx \\
  opentelemetry-instrumentation-httpx \\
  litellm
Step 2: Add Automatic Instrumentation
opentelemetry-bootstrap --action=install
Step 3: Instrument your LiteLLM SDK application
Initialize LiteLLM SDK instrumentation by calling litellm.callbacks = ["otel"]:
from litellm import litellm

litellm.callbacks = ["otel"]
This call enables automatic tracing, logs, and metrics collection for all LiteLLM SDK calls in your application.
📌 Note: Ensure this is called before any LiteLLM related calls to properly configure instrumentation of your application
Step 4: Run an example
from litellm import completion, litellm

litellm.callbacks = ["otel"]

response = completion(
  model="openai/gpt-4o",
  messages=[{ "content": "What is SigNoz","role": "user"}]
)

print(response)
📌 Note: LiteLLM supports a variety of model providers for LLMs. In this example, we're using OpenAI. Before running this code, ensure that you have set the environment variable
OPENAI_API_KEYwith your generated API key.
Step 5: Run your application with auto-instrumentation
OTEL_RESOURCE_ATTRIBUTES="service.name=<service_name>" \\
OTEL_EXPORTER_OTLP_ENDPOINT="https://ingest.<region>.signoz.cloud:443" \\
OTEL_EXPORTER_OTLP_HEADERS="signoz-ingestion-key=<your_ingestion_key>" \\
OTEL_EXPORTER_OTLP_PROTOCOL=grpc \\
OTEL_TRACES_EXPORTER=otlp \\
OTEL_METRICS_EXPORTER=otlp \\
OTEL_LOGS_EXPORTER=otlp \\
OTEL_PYTHON_LOG_CORRELATION=true \\
OTEL_PYTHON_LOGGING_AUTO_INSTRUMENTATION_ENABLED=true \\
OTEL_PYTHON_DISABLED_INSTRUMENTATIONS=openai \\
opentelemetry-instrument <your_run_command>
Note: OTLP gRPC requires
grpcio. Install viauv add "litellm[grpc]"(orgrpcio).
📌 Note: We're using
OTEL_PYTHON_DISABLED_INSTRUMENTATIONS=openaiin the run command to disable the OpenAI instrumentor for tracing. This avoids conflicts with LiteLLM's native telemetry/instrumentation, ensuring that telemetry is captured exclusively through LiteLLM's built-in instrumentation.
<service_name>is the name of your service- Set the
<region>to match your SigNoz Cloud region - Replace
<your_ingestion_key>with your SigNoz ingestion key - Replace
<your_run_command>with the actual command you would use to run your application. For example:python main.py
📌 Note: Using self-hosted SigNoz? Most steps are identical. To adapt this guide, update the endpoint and remove the ingestion key header as shown in Cloud → Self-Hosted.
Code-based instrumentation gives you fine-grained control over your telemetry configuration. Use this approach when you need to customize resource attributes, sampling strategies, or integrate with existing observability infrastructure.
Step 1: Install the necessary packages in your Python environment.
uv add \\
  opentelemetry-api \\
  opentelemetry-sdk \\
  opentelemetry-exporter-otlp \\
  opentelemetry-instrumentation-httpx \\
  opentelemetry-instrumentation-system-metrics \\
  litellm
Step 2: Import the necessary modules in your Python application
Traces:
from opentelemetry import trace
from opentelemetry.sdk.resources import Resource
from opentelemetry.sdk.trace import TracerProvider
from opentelemetry.sdk.trace.export import BatchSpanProcessor
from opentelemetry.exporter.otlp.proto.http.trace_exporter import OTLPSpanExporter
Logs:
from opentelemetry.sdk._logs import LoggerProvider, LoggingHandler
from opentelemetry.sdk._logs.export import BatchLogRecordProcessor
from opentelemetry.exporter.otlp.proto.http._log_exporter import OTLPLogExporter
from opentelemetry._logs import set_logger_provider
Metrics:
from opentelemetry.sdk.metrics import MeterProvider
from opentelemetry.exporter.otlp.proto.http.metric_exporter import OTLPMetricExporter
from opentelemetry.sdk.metrics.export import PeriodicExportingMetricReader
from opentelemetry import metrics
from opentelemetry.instrumentation.system_metrics import SystemMetricsInstrumentor
from opentelemetry.instrumentation.httpx import HTTPXClientInstrumentor
Step 3: Set up the OpenTelemetry Tracer Provider to send traces directly to SigNoz Cloud
from opentelemetry.sdk.resources import Resource
from opentelemetry.sdk.trace import TracerProvider
from opentelemetry.sdk.trace.export import BatchSpanProcessor
from opentelemetry.exporter.otlp.proto.http.trace_exporter import OTLPSpanExporter
from opentelemetry import trace

resource = Resource.create({"service.name": "<service_name>"})
provider = TracerProvider(resource=resource)
span_exporter = OTLPSpanExporter(
    endpoint= os.getenv("OTEL_EXPORTER_TRACES_ENDPOINT"),
    headers={"signoz-ingestion-key": os.getenv("SIGNOZ_INGESTION_KEY")},
)
processor = BatchSpanProcessor(span_exporter)
provider.add_span_processor(processor)
trace.set_tracer_provider(provider)
<service_name>is the name of your serviceOTEL_EXPORTER_TRACES_ENDPOINT→ SigNoz Cloud trace endpoint with appropriate region:https://ingest.<region>.signoz.cloud:443/v1/tracesSIGNOZ_INGESTION_KEY→ Your SigNoz ingestion key
📌 Note: Using self-hosted SigNoz? Most steps are identical. To adapt this guide, update the endpoint and remove the ingestion key header as shown in Cloud → Self-Hosted.
Step 4: Setup Logs
from opentelemetry.sdk.resources import Resource
from opentelemetry._logs import set_logger_provider
from opentelemetry.sdk._logs import LoggerProvider, LoggingHandler
from opentelemetry.sdk._logs.export import BatchLogRecordProcessor
from opentelemetry.exporter.otlp.proto.http._log_exporter import OTLPLogExporter

resource = Resource.create({"service.name": "<service_name>"})
logger_provider = LoggerProvider(resource=resource)
set_logger_provider(logger_provider)

otlp_log_exporter = OTLPLogExporter(
    endpoint= os.getenv("OTEL_EXPORTER_LOGS_ENDPOINT"),
    headers={"signoz-ingestion-key": os.getenv("SIGNOZ_INGESTION_KEY")},
)
logger_provider.add_log_record_processor(
    BatchLogRecordProcessor(otlp_log_exporter)
)
# Attach OTel logging handler to root logger
handler = LoggingHandler(level=logging.INFO, logger_provider=logger_provider)
logging.basicConfig(level=logging.INFO, handlers=[handler])

logger = logging.getLogger(__name__)
<service_name>is the name of your serviceOTEL_EXPORTER_LOGS_ENDPOINT→ SigNoz Cloud endpoint with appropriate region:https://ingest.<region>.signoz.cloud:443/v1/logsSIGNOZ_INGESTION_KEY→ Your SigNoz ingestion key
📌 Note: Using self-hosted SigNoz? Most steps are identical. To adapt this guide, update the endpoint and remove the ingestion key header as shown in Cloud → Self-Hosted.
Step 5: Setup Metrics
from opentelemetry.sdk.resources import Resource
from opentelemetry.sdk.metrics import MeterProvider
from opentelemetry.exporter.otlp.proto.http.metric_exporter import OTLPMetricExporter
from opentelemetry.sdk.metrics.export import PeriodicExportingMetricReader
from opentelemetry import metrics
from opentelemetry.instrumentation.system_metrics import SystemMetricsInstrumentor

resource = Resource.create({"service.name": "<service-name>"})
metric_exporter = OTLPMetricExporter(
    endpoint= os.getenv("OTEL_EXPORTER_METRICS_ENDPOINT"),
    headers={"signoz-ingestion-key": os.getenv("SIGNOZ_INGESTION_KEY")},
)
reader = PeriodicExportingMetricReader(metric_exporter)
metric_provider = MeterProvider(metric_readers=[reader], resource=resource)
metrics.set_meter_provider(metric_provider)

meter = metrics.get_meter(__name__)

# turn on out-of-the-box metrics
SystemMetricsInstrumentor().instrument()
HTTPXClientInstrumentor().instrument()
<service_name>is the name of your serviceOTEL_EXPORTER_METRICS_ENDPOINT→ SigNoz Cloud endpoint with appropriate region:https://ingest.<region>.signoz.cloud:443/v1/metricsSIGNOZ_INGESTION_KEY→ Your SigNoz ingestion key
📌 Note: Using self-hosted SigNoz? Most steps are identical. To adapt this guide, update the endpoint and remove the ingestion key header as shown in Cloud → Self-Hosted.
📌 Note: SystemMetricsInstrumentor provides system metrics (CPU, memory, etc.), and HTTPXClientInstrumentor provides outbound HTTP request metrics such as request duration. If you want to add custom metrics to your LiteLLM application, see Python Custom Metrics.
Step 6: Instrument your LiteLLM application
Initialize LiteLLM SDK instrumentation by calling litellm.callbacks = ["otel"]:
from litellm import litellm

litellm.callbacks = ["otel"]
This call enables automatic tracing, logs, and metrics collection for all LiteLLM SDK calls in your application.
📌 Note: Ensure this is called before any LiteLLM related calls to properly configure instrumentation of your application
Step 7: Run an example
from litellm import completion, litellm

litellm.callbacks = ["otel"]

response = completion(
  model="openai/gpt-4o",
  messages=[{ "content": "What is SigNoz","role": "user"}]
)

print(response)
📌 Note: LiteLLM supports a variety of model providers for LLMs. In this example, we're using OpenAI. Before running this code, ensure that you have set the environment variable
OPENAI_API_KEYwith your generated API key.
View Traces, Logs, and Metrics in SigNoz
Your LiteLLM commands should now automatically emit traces, logs, and metrics.
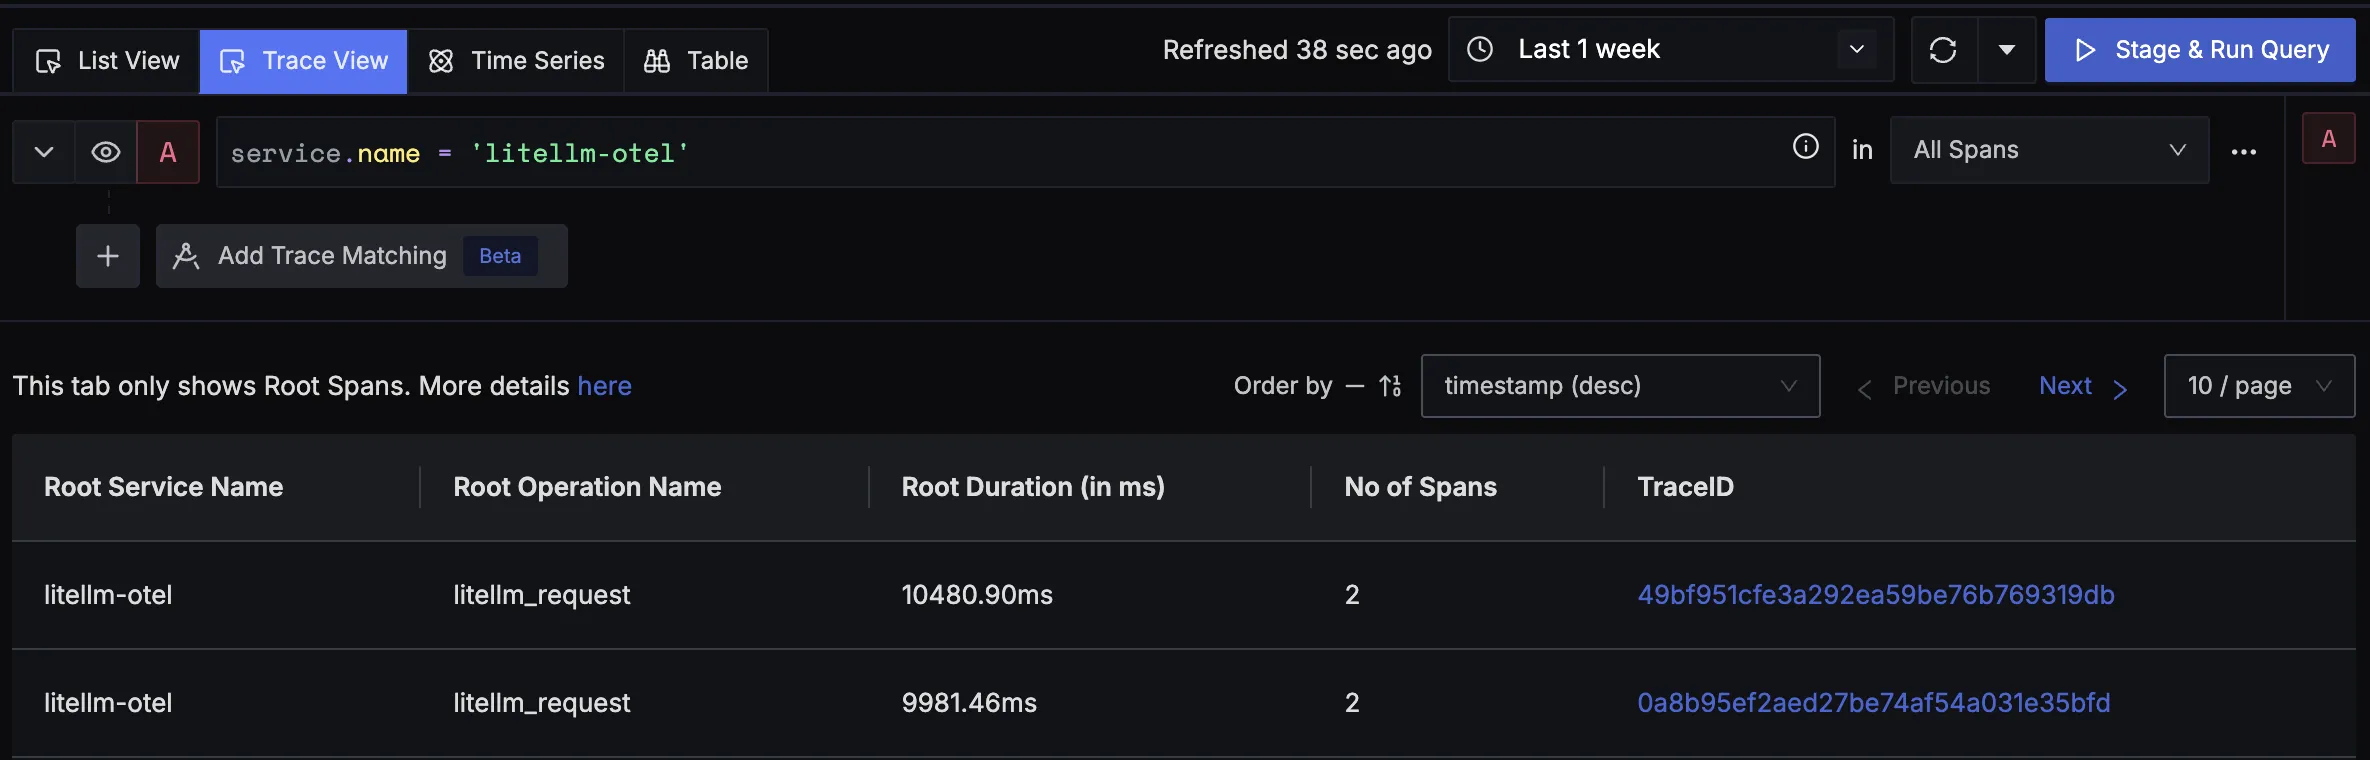
You should be able to view traces in Signoz Cloud under the traces tab:
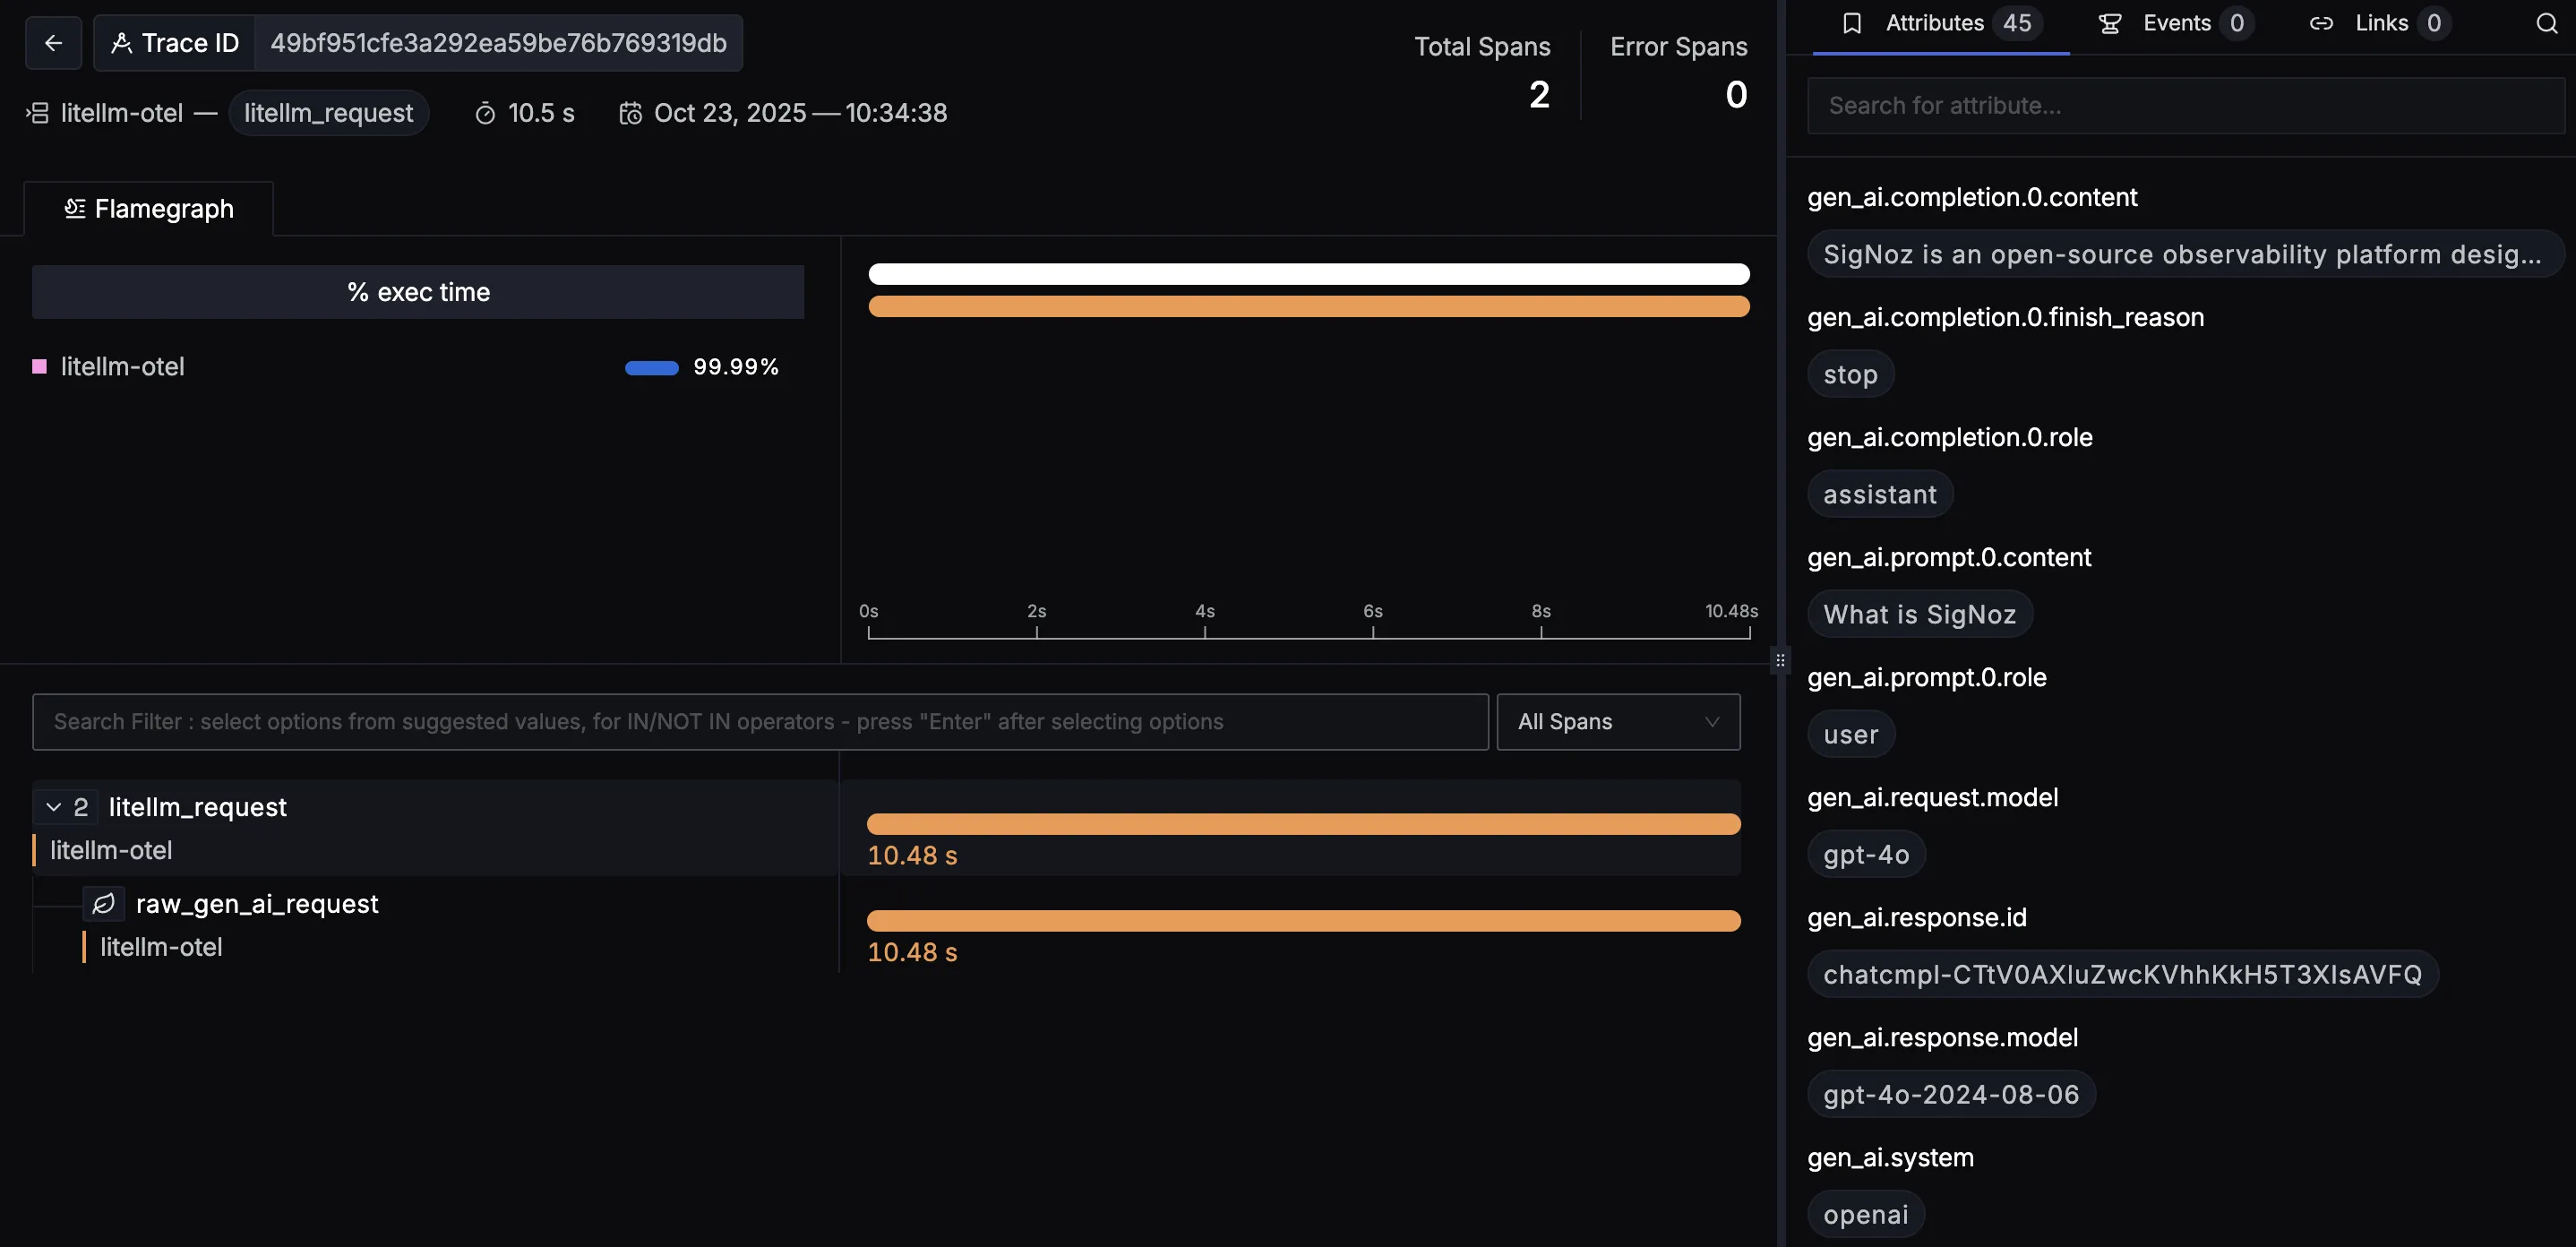
When you click on a trace in SigNoz, you'll see a detailed view of the trace, including all associated spans, along with their events and attributes.
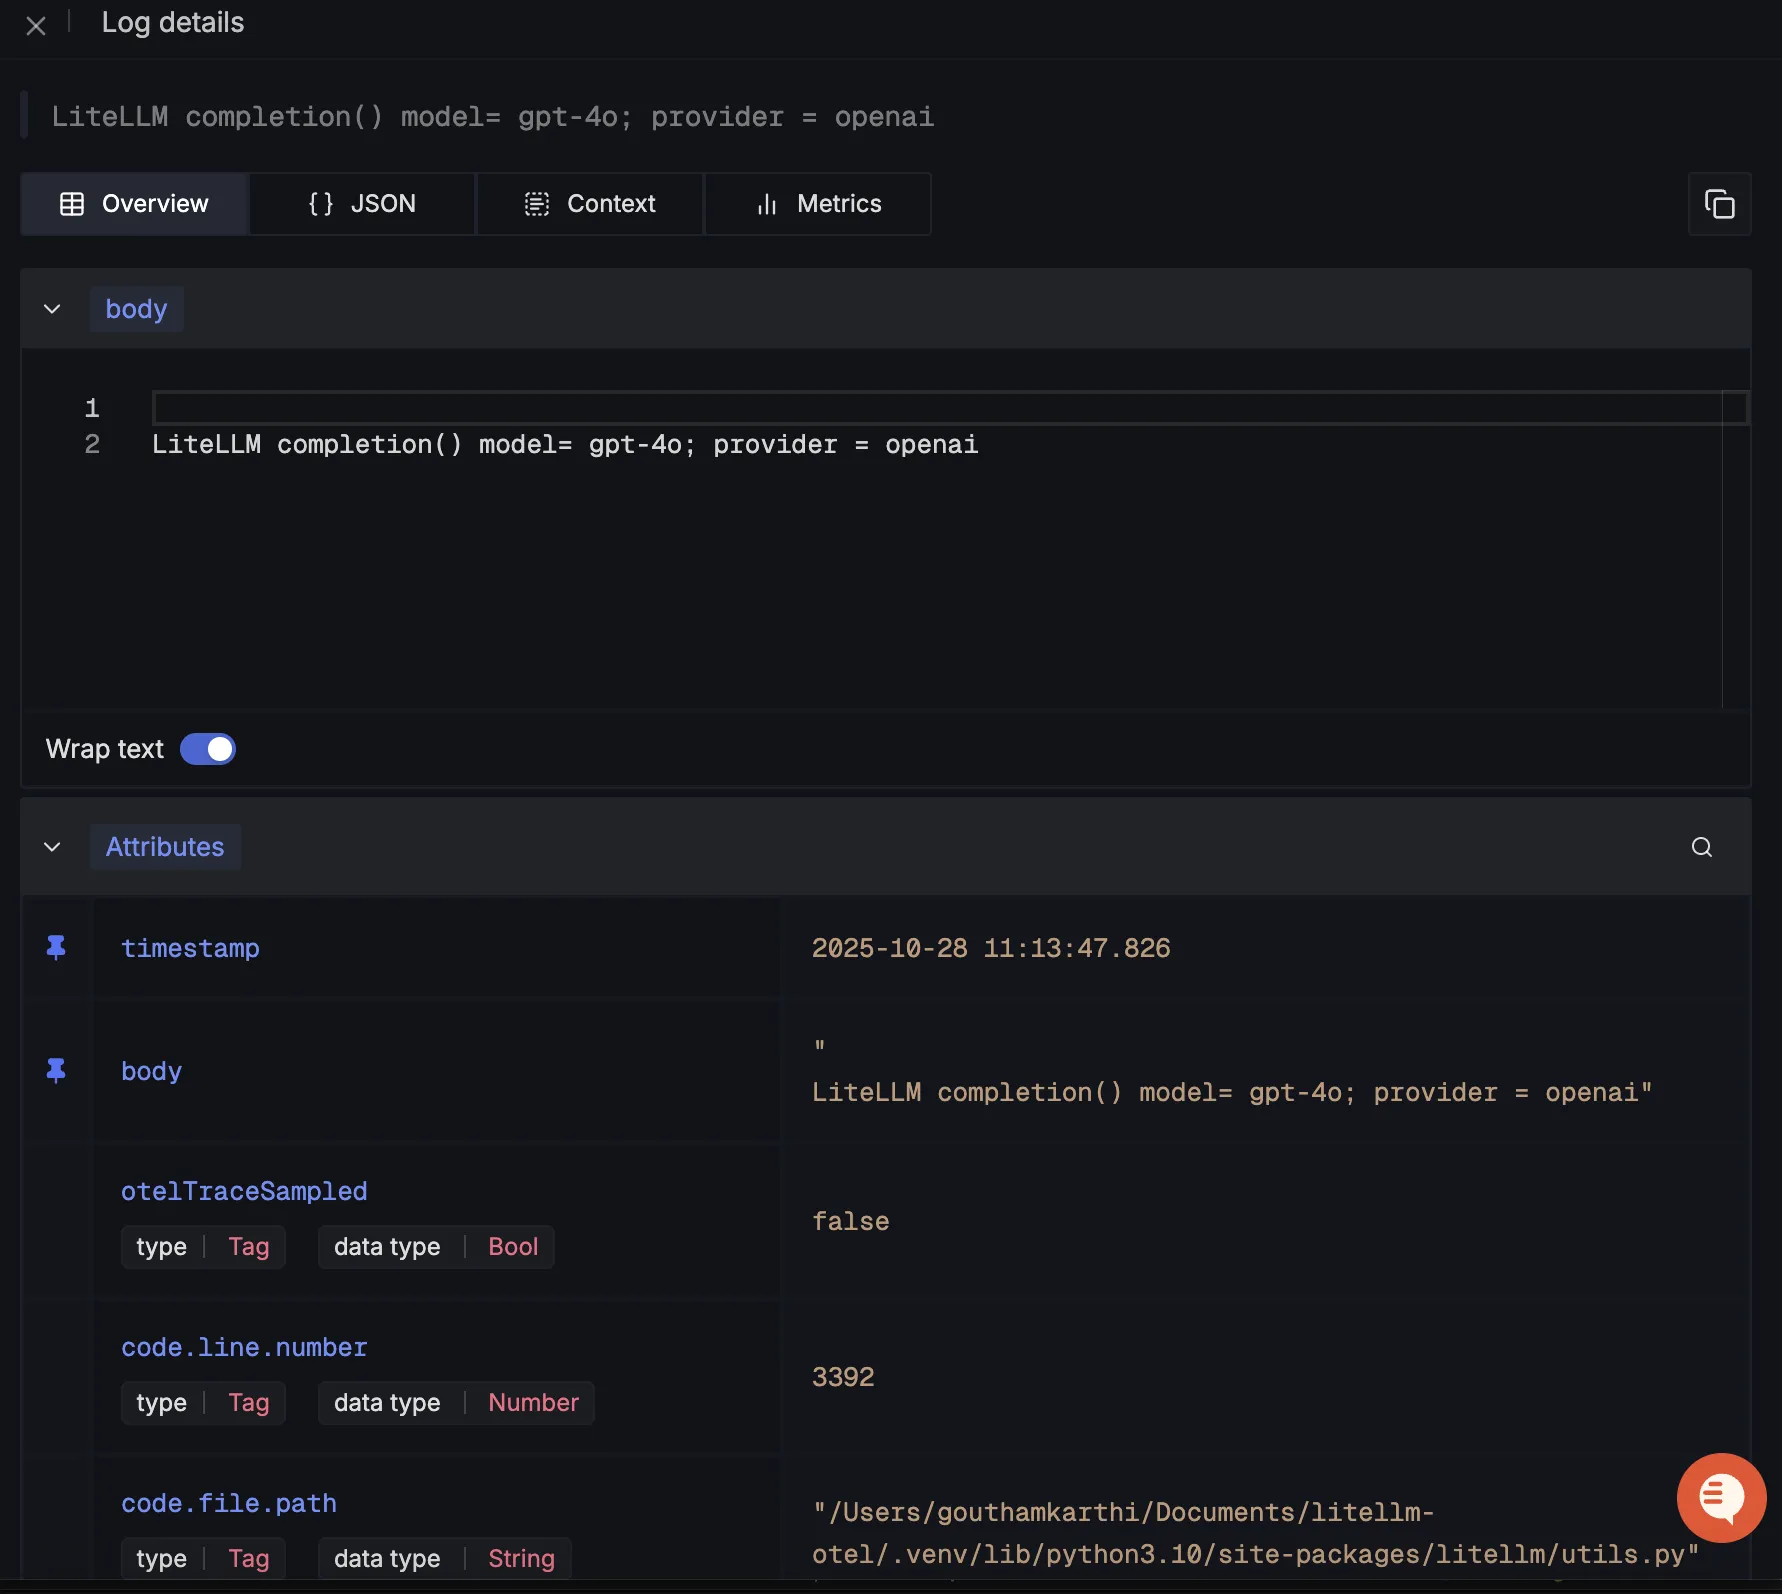
You should be able to view logs in Signoz Cloud under the logs tab. You can also view logs by clicking on the “Related Logs” button in the trace view to see correlated logs:

When you click on any of these logs in SigNoz, you'll see a detailed view of the log, including attributes:
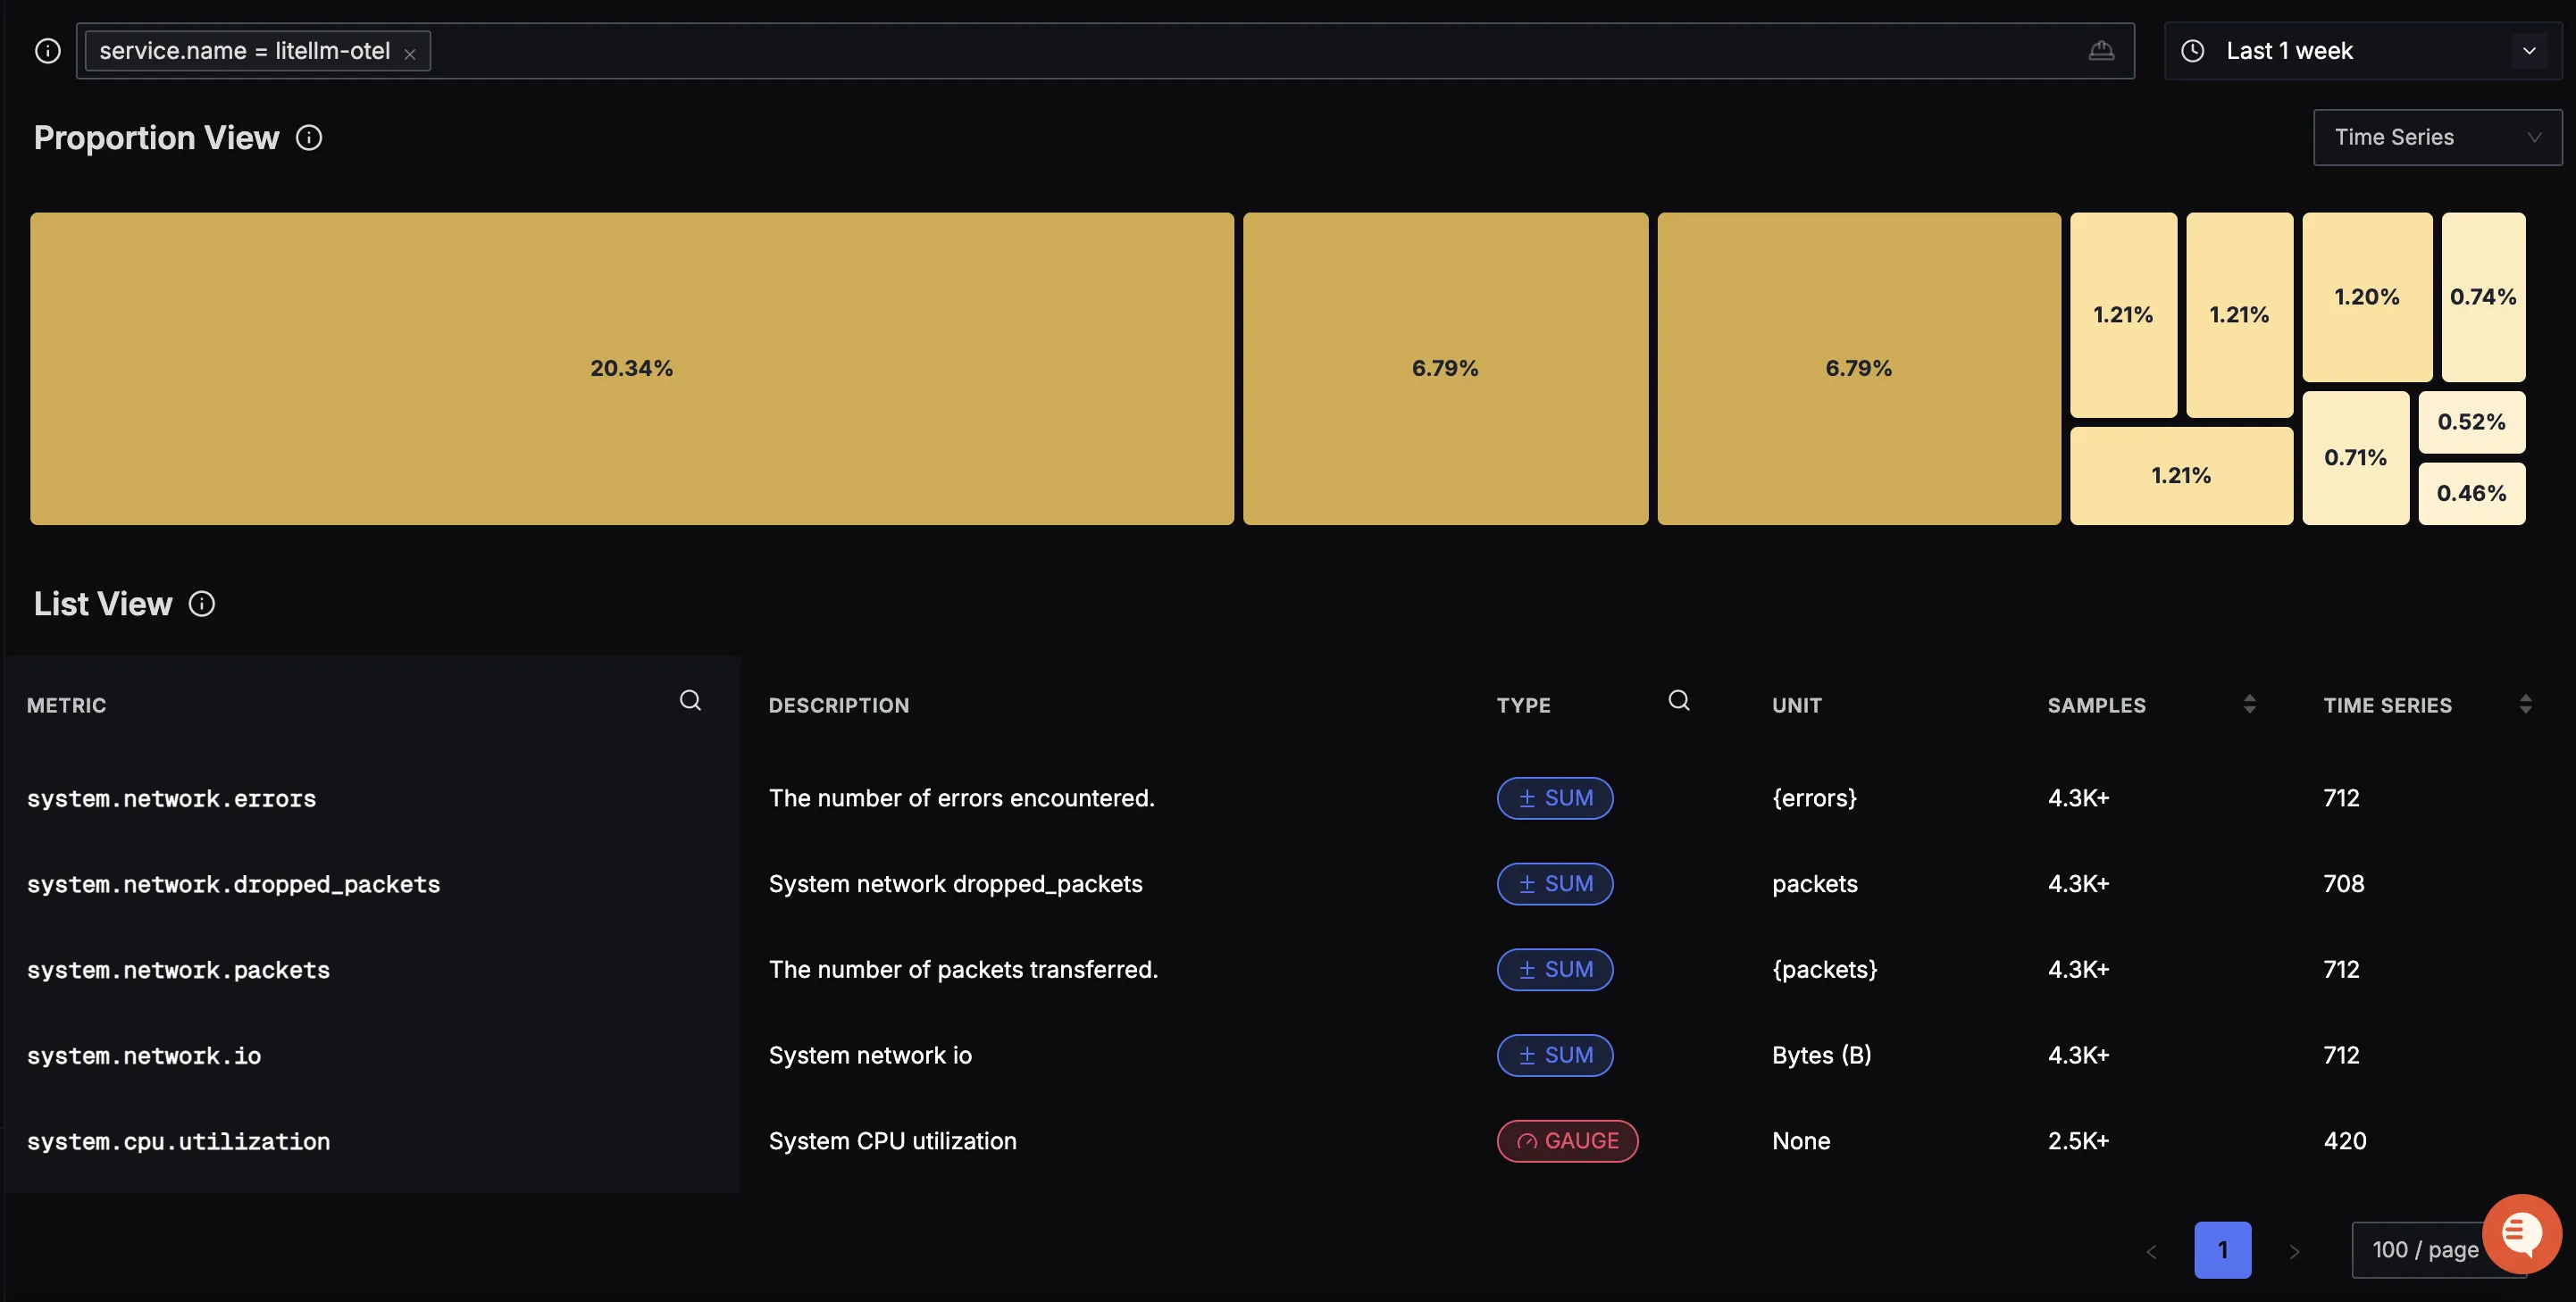
You should be able to see LiteLLM related metrics in Signoz Cloud under the metrics tab:
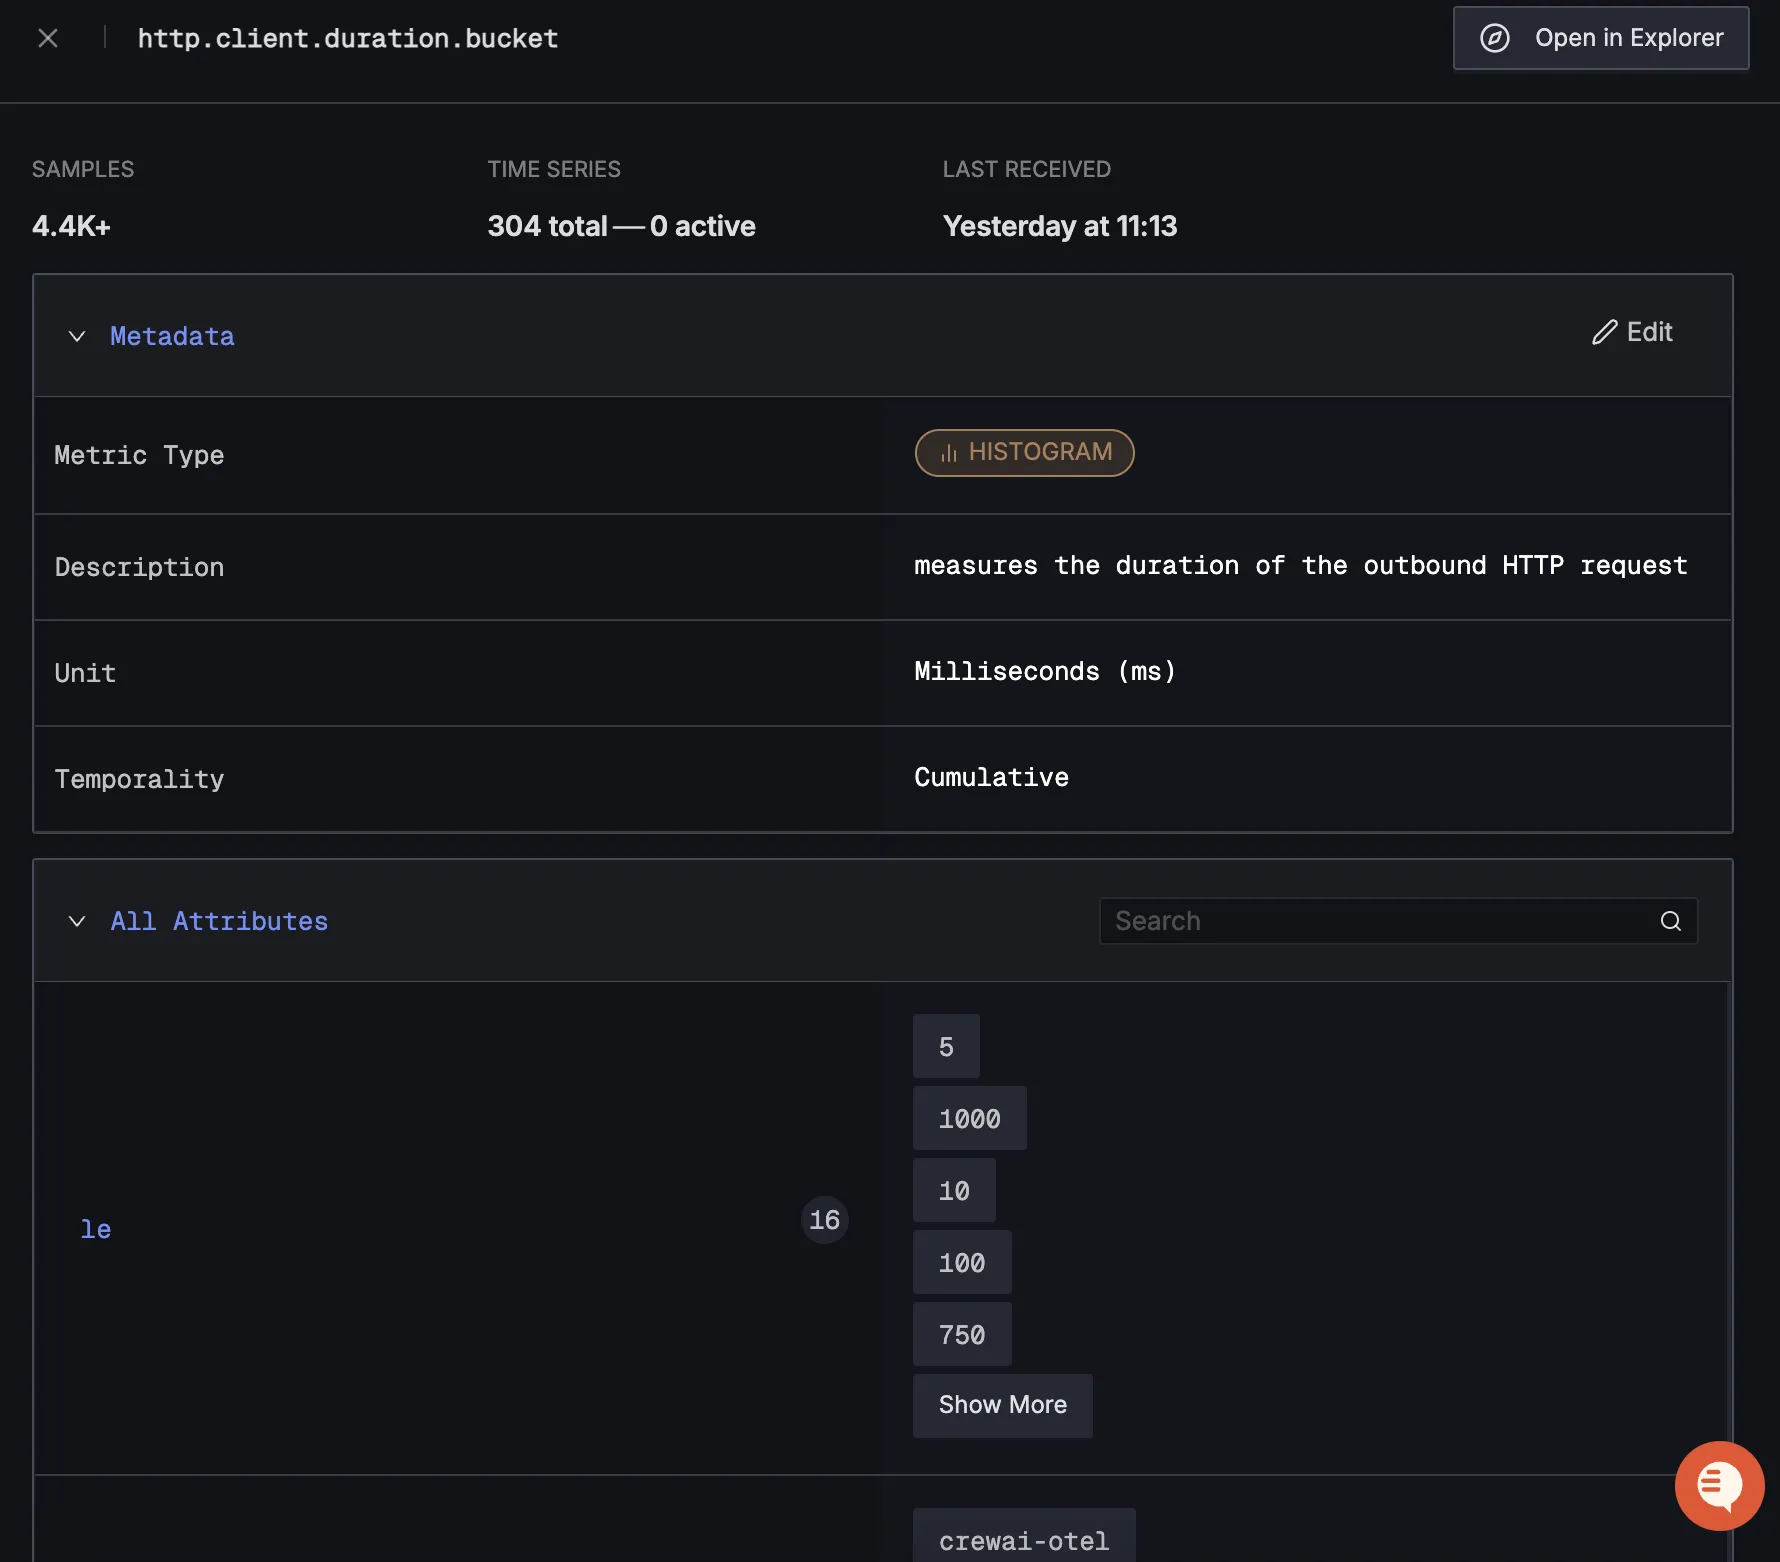
When you click on any of these metrics in SigNoz, you'll see a detailed view of the metric, including attributes:
Dashboard
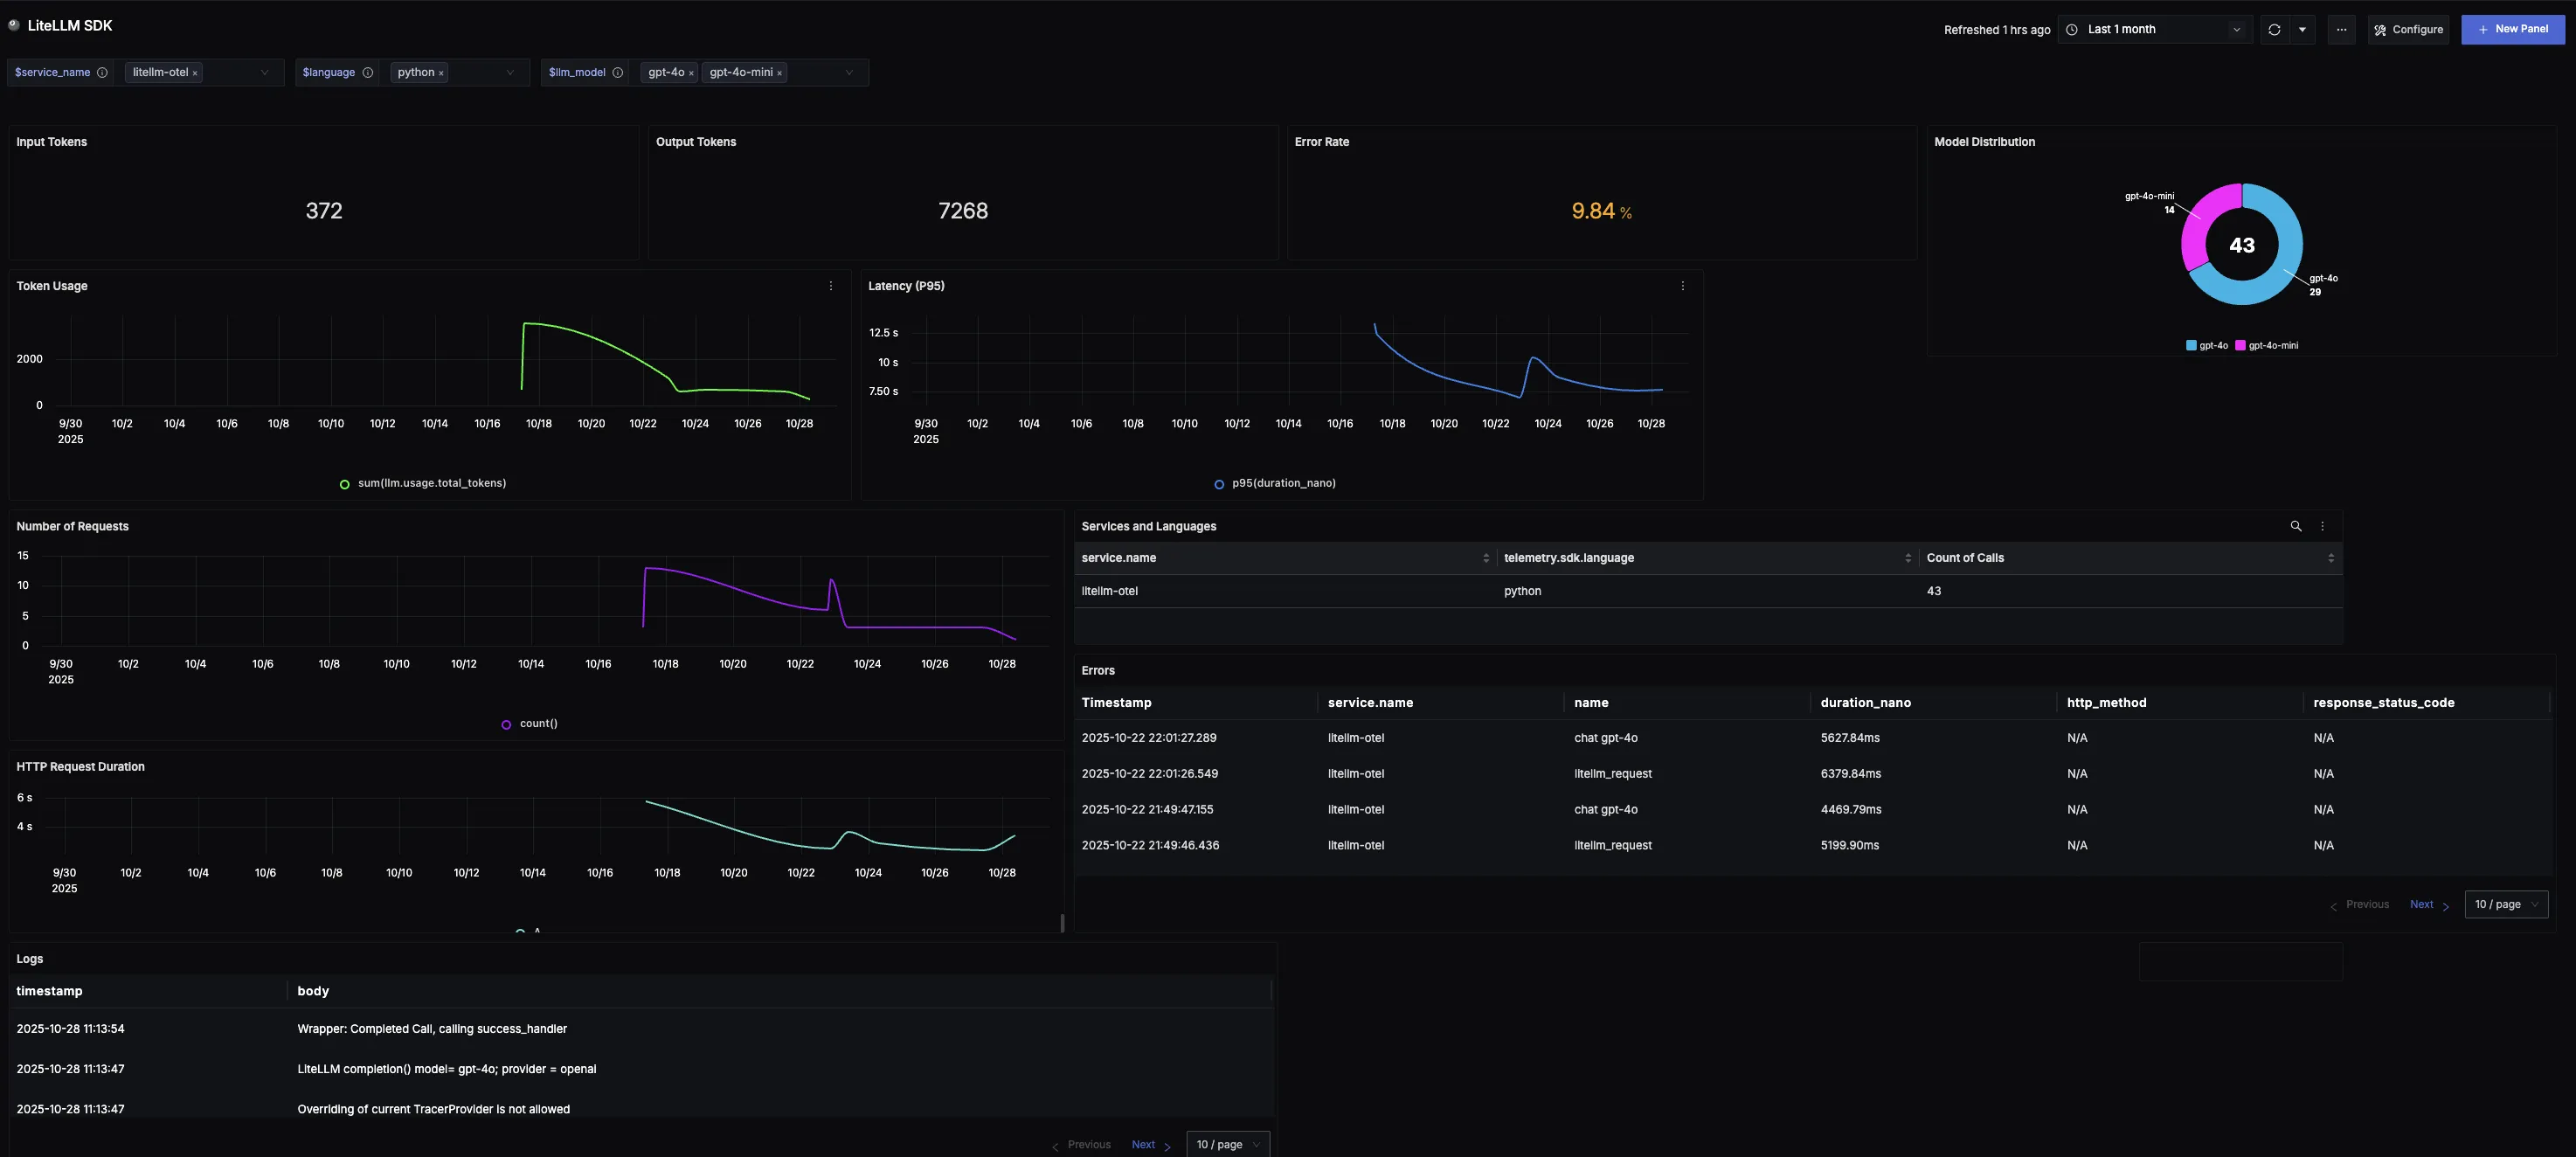
You can also check out our custom LiteLLM SDK dashboard here which provides specialized visualizations for monitoring your LiteLLM usage in applications. The dashboard includes pre-built charts specifically tailored for LLM usage, along with import instructions to get started quickly.
Step 1: Install the necessary packages in your Python en